Introduction
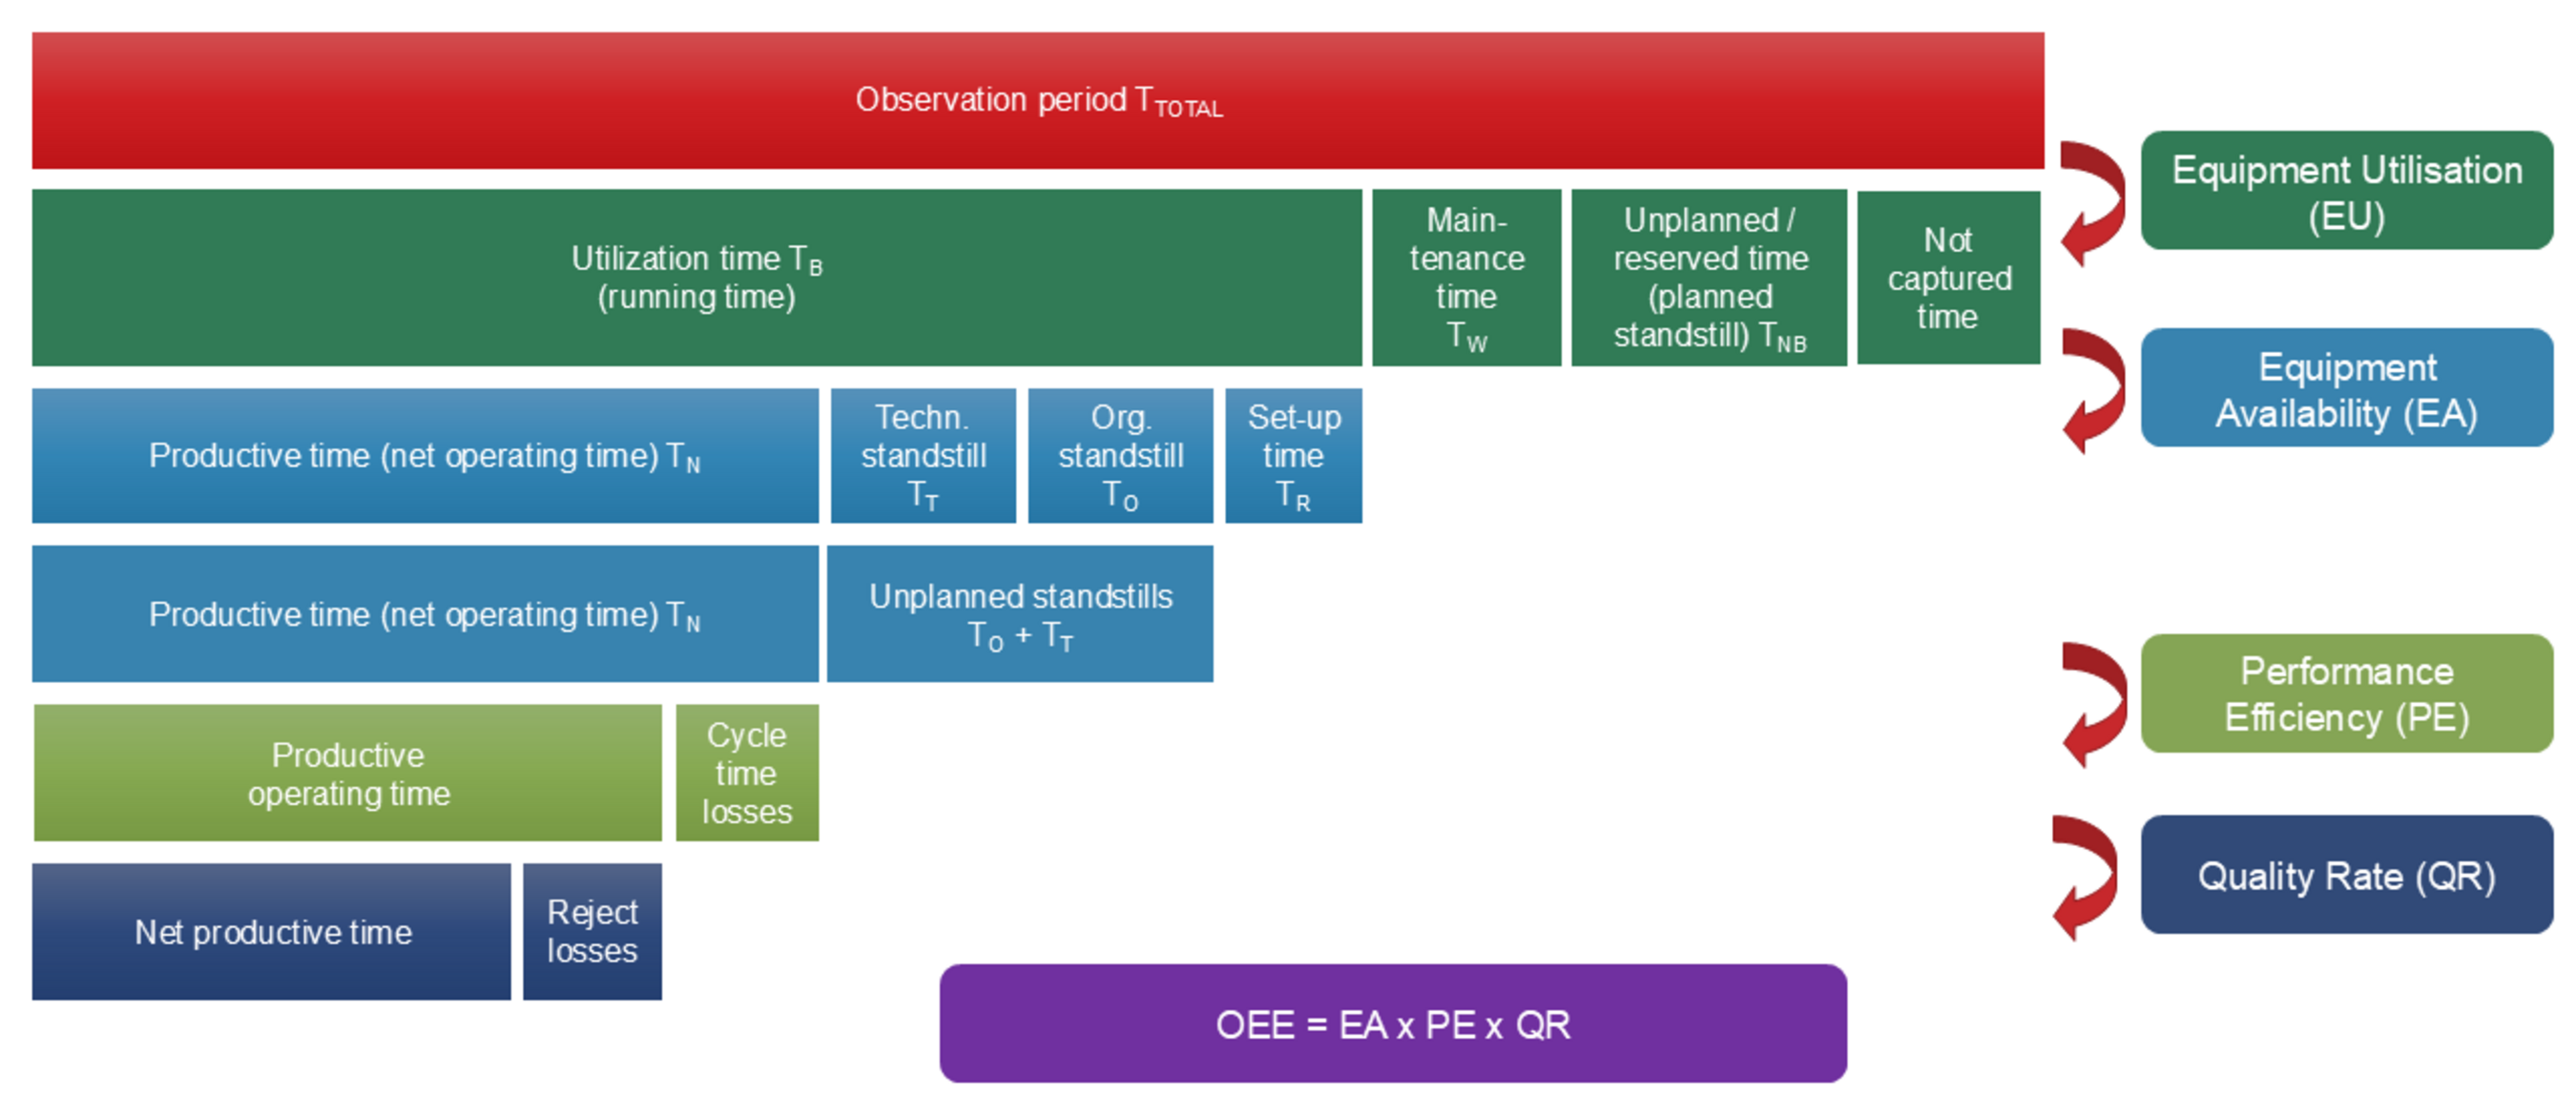
One of the most powerful metrics to understand the current performance of your equipment is the Overall Equipment Effectiveness (OEE). The OEE is a standardized metric defined in the VDI 3423 (Verein Deutscher Ingeneure - Association of German Engineers) and provides a comprehensive view of how well your manufacturing operation is performing, identifying hidden losses and opportunities for improvement.
But how exactly is OEE calculated, and more importantly, how can you leverage this information to drive real change? Let's break it down.
What is OEE? The Foundation of Manufacturing Efficiency
At its core, Overall Equipment Effectiveness (OEE) is a measure that indicates how efficiently a machine works as a whole . It's not just about how many units you produce, but how many good units you produce, as fast as possible, without unplanned stops.


OEE is the product of three critical key performance indicators (KPIs):
By dissecting your operational performance into these three components, OEE helps pinpoint exactly where your losses are occurring – whether it's due to downtime, slow production, or quality issues.

The Three Pillars of OEE
Let's look at each component in detail:
1. Equipment Availability (EA)

Equipment Availability (EA) describes the ratio of productive time to utilization time. Simply put, it tells you whether the machine is running and producing parts, or if it's standing still.
A high EA means your machine is available to produce when it's supposed to be.
Calculation:

- Utilization Time (TB): This is the period of time for which production was planned.
- Productive Time (TN): This is the time when the machine is actually producing, after deducting technical standstills, organizational standstills, and setup times from the utilization time.
Common losses impacting EA include:
- Technical Standstills (TT): Downtime due to machine breakdowns or technical defects.
- Organizational Standstills (TO): Downtime due to factors like no orders, missing parts, or lack of tools.
- Setup / Changeover Time (TR): Time spent preparing the machine for a new product, from the last good part of the old order to the first good part of the new order.
2. Performance Efficiency (PE)

Performance Efficiency (PE) measures the speed at which the machine operates compared to its ideal or specified cycle time . It's the ratio of productive operating time to productive time and quantifies losses caused by increased cycle times. If your machine is running slower than its target speed, your PE will drop.
Calculation:

Losses affecting PE typically involve:
- Reduced Production Speed: Instances where the machine is running but at a slower pace than its theoretical maximum.
3. Quality Rate (QR)

Quality Rate (QR) focuses on the output of good parts (OK) compared to the total parts produced. This metric highlights losses due to defective products that require rework or are scrapped entirely.
Calculation:

The main factor impacting QR is:
- Reject Losses: The number of non-conforming parts (NOK parts) that do not meet quality standards.
- Reworked parts: The number of parts that needed reworking, no matter if the machine has a autoamted rework routine or a manual rework or analysis station.
Putting It All Together: A Calculation Example
To better understand the calculations, let's use an automated assembly station producing one part every 90 seconds.
Given Data:
- Target Cycle Time: 1.5 minutes (90 seconds)
- Parts Per Cycle: 1
- Produced Parts: 420 pcs
- NOK Parts / Rejects: 6 pcs
- Observation Period (Ttotal): 24 hours = 1.440 minutes
- Unplanned Time (e.g., 3rd shift): 480 minutes
- Break Time: 60 minutes (2 x 30 minutes during 2 shifts)
- Setup / Changeover Time (TR): 70 minutes
- Unplanned Standstills (TT, TO): 80 minutes
- Idle Time / Reduced Production Speed: 70 minutes
Step 1: Calculate Key Time Components:
- Utilization Time (TB): Ttotal - Unplanned Time - Break Time
1.440 min - 480 min - 60 min = 900 min - Productive Time (TN): TB - Setup Time - Unplanned Standstills
900 min - 70 min - 80 min = 750 min - Productive Operating Time: TN - Idle Time / Reduced Production Speed
750 min - 70 min = 680 min - Net Productive Time: Productive Operating Time - (NOK Parts × Target Cycle Time)
680 min - (6 pcs × 1.5 min/pc) = 680 min - 9 min = 671 min
Step 2: Calculate Each OEE Component
- Equipment Availability (EA): TN / TB
750 min / 900 min = 0.833 = 83.3% - Performance Efficiency (PE): (Target Cycle Time × Produced Parts) / (Parts Per Cycle × Productive Time)
(1.5 min/pc × 420 pcs) / (1 pc/cycle × 750 min) = 630 / 750 = 0.840 = 84.0% - Quality Rate (QR): (Produced Parts - NOK Parts) / Produced Parts
(420 pcs - 6 pcs) / 420 pcs = 414 / 420 = 0.986 = 98.6%
Step 3: Calculate OEE
- OEE = EA × PE × QR
83.3% × 84.0% × 98.6% = 0.833 × 0.840 × 0.986 = 0.690 = 69.0%
Beyond OEE: Equipment Utilization (EU) and TEEP
While OEE focuses on the efficiency during planned production time, two other important KPIs offer an even broader perspective:
Equipment Utilization (EU)

Equipment Utilization (EU) describes the percentage use of the machine within the total observation period . It's often considered a "planning" KPI, indicating how much the machine should produce .
Calculation:

Example Calculation:
EU = 900 min / 1.440 min = 0.625 = 62.5%
Total Effective Equipment Productivity (TEEP)
TEEP is the ultimate measure of productivity, combining OEE with Equipment Utilization . It takes into account all available time, including periods when production was not planned.
Calculation:
TEEP = OEE × EU
A low value for either OEE or EU will negatively affect TEEP, giving you a full picture of overall productivity.
Example Calculation:
TEEP = 69.0% × 62.5% = 0.690 × 0.625 = 0.431 = 43.1%
Making the Most of Your OEE Data
Calculating OEE and its related KPIs is just the first step. The real value comes from interpreting these numbers and using them to drive continuous improvement.
- Identify Bottlenecks: A low OEE score, or a particularly low component (EA, PE, or QR), immediately highlights areas needing attention. If EA is low, focus on reducing downtime through better maintenance or operational scheduling. If PE is low, look into cycle time losses and optimization opportunities. If QR is low, invest in quality control and process improvements.
- Quantify Losses: OEE provides a clear, data-driven way to quantify how much production capacity is being lost due to various factors. This allows for evidence-based decision-making rather than relying on guesswork.
- Prioritize Improvements: By understanding the impact of each loss type on your OEE, you can prioritize improvement initiatives that will yield the greatest return. For instance, reducing a major source of downtime might have a more significant impact than a minor speed optimization.
- Benchmark Performance: OEE allows you to benchmark your performance against industry standards or your own historical data, setting realistic goals for improvement.
- Foster a Culture of Improvement: Regular OEE tracking encourages teams to identify and solve problems, fostering a culture of operational excellence and continuous improvement.
OEE is more than just a metric; it's a powerful diagnostic tool that translates raw production data into actionable insights. By correctly calculating and consistently analyzing OEE, EU, and TEEP, manufacturers can unlock significant gains in productivity, reduce costs, and achieve operational excellence.
Invest in clarity. The Proof of Value provides a complete OEE breakdown and specific optimization opportunities—so you know exactly where to focus for maximum impact.
Would you like to learn more? We are here for you!