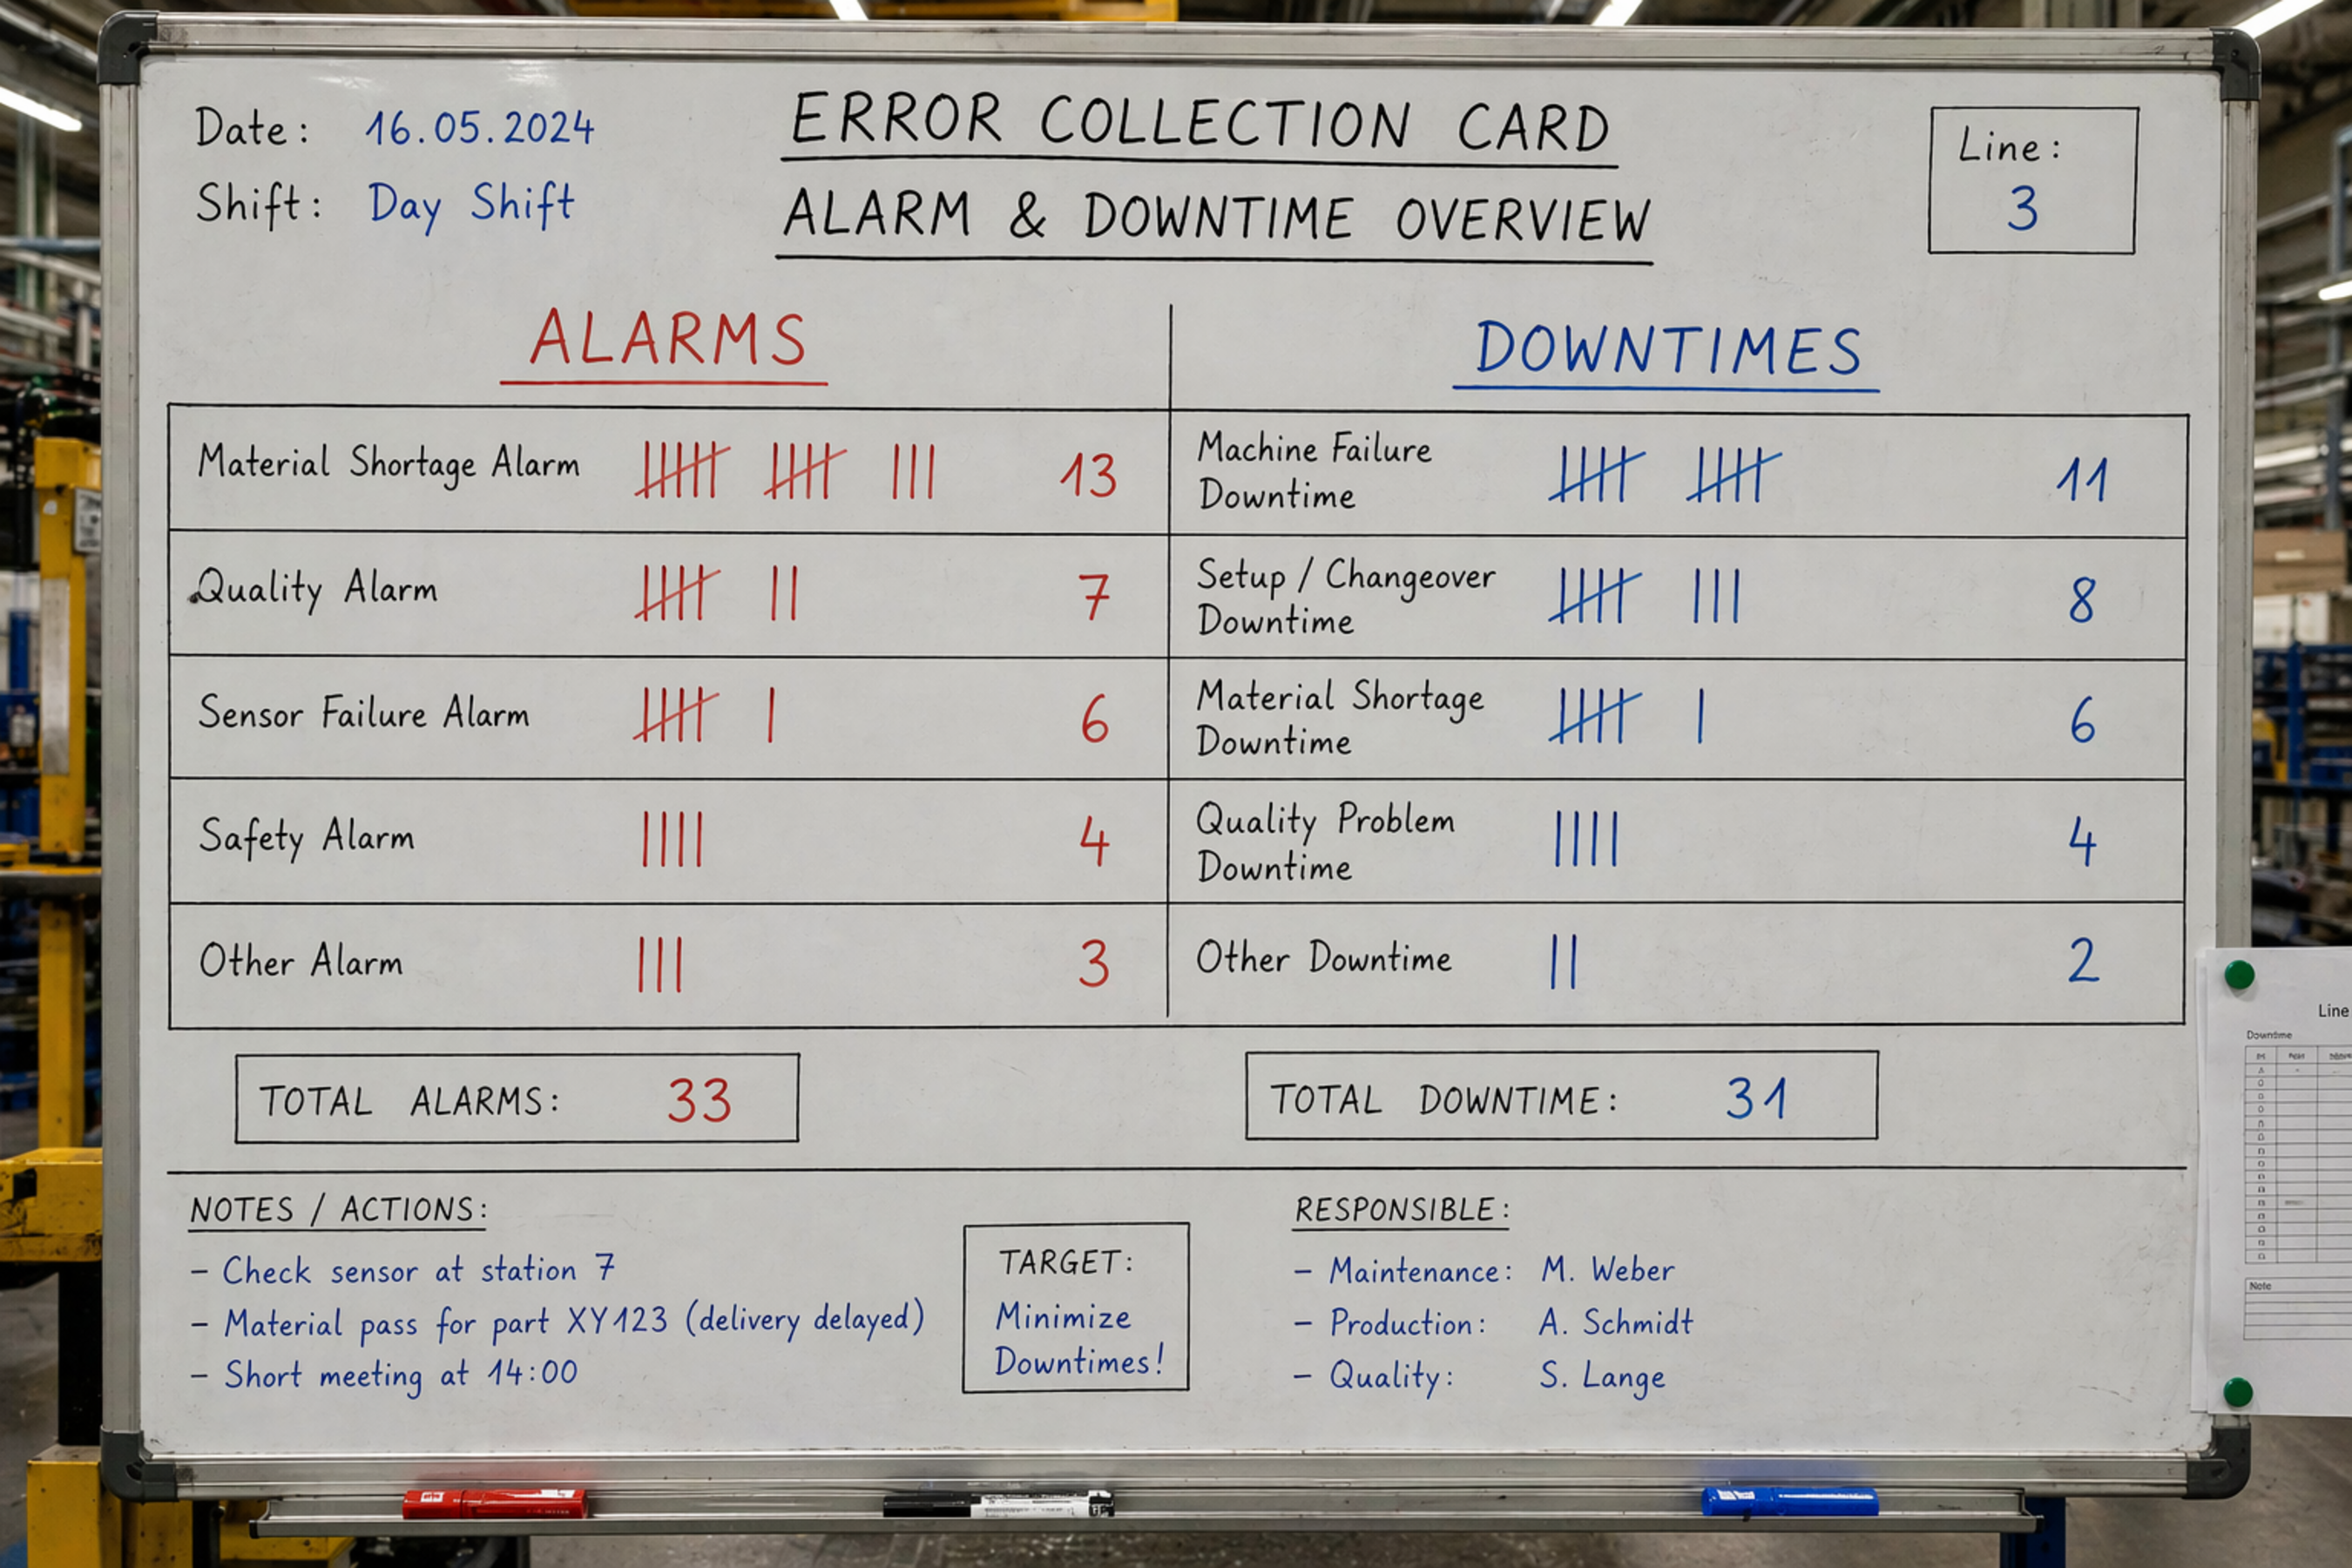
Walk through almost any production hall and you’ll still find them: whiteboards filled with tally marks, handwritten error lists, and carefully maintained “error collection cards.” They create visibility and structure, but they also come with a hidden downside.
These systems rely on manual input. People need to remember to log events, interpret them correctly, and stay consistent across shifts. In reality, this leads to gaps, inconsistencies, and assumptions. The same issue might be classified differently depending on who writes it down. What looks structured often isn’t reliable.
And that becomes a real problem when it comes to machine standstills.


Many companies track alarms and downtime, but often mix them up. Alarms simply indicate that something happened. They can occur frequently and even in parallel without stopping production. A standstill, however, is different. It means the machine is no longer producing, a direct loss of time and output.
Understanding this difference is key.
A standstill is typically defined by time: if no part leaves the machine within a certain window, it is considered a stop. But identifying a standstill is only the first step. The real value lies in understanding why it happened.
To make downtime actionable, it needs to be classified correctly. Most companies use three categories:
- Technical (TT): machine-related issues
- Organizational (TO): external factors like missing material or personnel
- Related losses (TR): planned activities like setup, maintenance or changeover
This sounds simple, but in practice, it’s where things go wrong.
Imagine a machine stops due to missing material but is recorded as a technical issue. The conclusion would be to fix the machine, while the real issue lies in logistics. Wrong classification leads to wrong decisions.
Manual systems struggle here because they rely on interpretation. Context is often missing, and reasons are assigned after the fact.
Modern systems take a different approach. Instead of relying on human input, they use machine data, such as alarms, machine states, and production flow, to automatically detect standstills and assign reasons.
This makes the data:
- Objective
- Consistent
- Tamper-proof
It also allows systems to consider context. A stop during setup is not the same as a stop during production. Capturing this difference manually is difficult, but essential for meaningful insights.
Another important point: while only one machine standstill can occur at a time, multiple issues may happen in parallel. Digital systems apply logic to determine the primary cause, ensuring each stop has one clear reason.

Whiteboards still have their place for communication and quick alignment on the shopfloor. But they should not be the foundation of your data.
Real improvement starts when companies move from manual tracking to structured, automated insight.
Because in the end:
It’s not about how much downtime you track—but how accurately you understand it.
If you want to move beyond whiteboards, assumptions, and inconsistent data, you need a system that doesn’t just collect information, but understands it.
Every improvement initiative starts with reliable data.
If machine standstills are classified incorrectly, even the best teams risk solving the wrong problems. Automated downtime classification provides the transparency needed to identify root causes, prioritize improvement efforts, and increase productivity with confidence.
Discover how a structured approach to downtime analysis can help uncover hidden productivity losses across your production environment.
Would you like to learn more? We are here for you!